AkShare 介绍
AkShare 是基于 Python 的财经数据接口库, 目的是实现对股票、期货、期权、基金、外汇、债券、指数、加密货币等金融产品的基本面数据、实时和历史行情数据、衍生数据从数据采集、数据清洗到数据落地的一套工具,主要用于学术研究目的。
可以编写 Python 代码,利用 AkShare 自动化获取股票、基金等金融数据。
项目文档:https://www.akshare.xyz/zh_CN/latest/index.html
项目Github:https://github.com/jindaxiang/akshare
用 AkShare 获取上证指数历史数据
上证指数的代码为 sh000001
                open      high       low     close        volume

date

1990-12-19    96.050    99.980    95.790    99.980  1.260000e+05

1990-12-20   104.300   104.390    99.980   104.390  1.970000e+04

1990-12-21   109.070   109.130   103.730   109.130  2.800000e+03

1990-12-24   113.570   114.550   109.130   114.550  3.200000e+03

1990-12-25   120.090   120.250   114.550   120.250  1.500000e+03

.             .      .      .      .          ...

2020-11-05  3305.580  3320.408  3291.600  3320.133  2.268015e+10

2020-11-06  3326.465  3326.465  3292.151  3312.159  2.348641e+10

2020-11-09  3329.429  3380.824  3329.429  3373.734  3.102198e+10

2020-11-10  3387.622  3387.622  3346.172  3360.149  2.787011e+10

2020-11-11  3354.025  3365.836  3339.041  3342.203  2.712047e+10


[7307 rows x 5 columns]
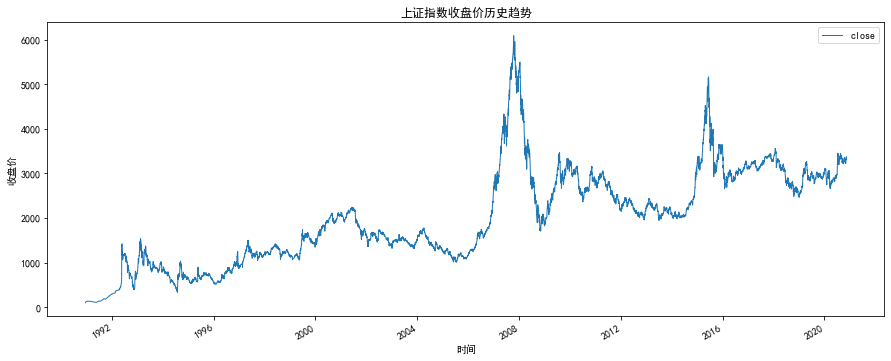
绘制上证指数历史收盘价变化趋势
单独提取出收盘价的历史数据
date

1990-12-19      99.980

1990-12-20     104.390

1990-12-21     109.130

1990-12-24     114.550

1990-12-25     120.250

                .

2020-11-05    3320.133

2020-11-06    3312.159

2020-11-09    3373.734

2020-11-10    3360.149

2020-11-11    3342.203

Name: close, Length: 7307, dtype: float64
绘制趋势图
| |